
Vertical Analysis
Horizontal- Vertical Analysis

What is Vertical Analysis ?
Vertical Analysis is a method of analyzing financial statements that shows each item on a statement as a percentage of a base figure within the statement.
A vertical analysis of a balance sheet uses the total of assets as a base figure. All individual assets (or groups of assets if condensed form balance sheet is used) are shown as a percentage of total assets. The current liabilities, long term debts and equities are also shown as a percentage of the total assets.
A vertical analysis of an income statement uses the sales figure as the base and all other components of the income statement are shown as a percentage of sales.
These analyses can be prepared for one or more periods; however, preparing comparitive statements (more than one period) enhances the usefulness of the analysis and aids you in detecting patterns and trends and identifying any areas that may need further investigation and attention.
In a vertical analysis, the percentage is computed by using the following formula:
Percentage of base = (Amount of individual item/Amount of base item) × 100
Sample Vertical Analysis Of a Balance Sheet
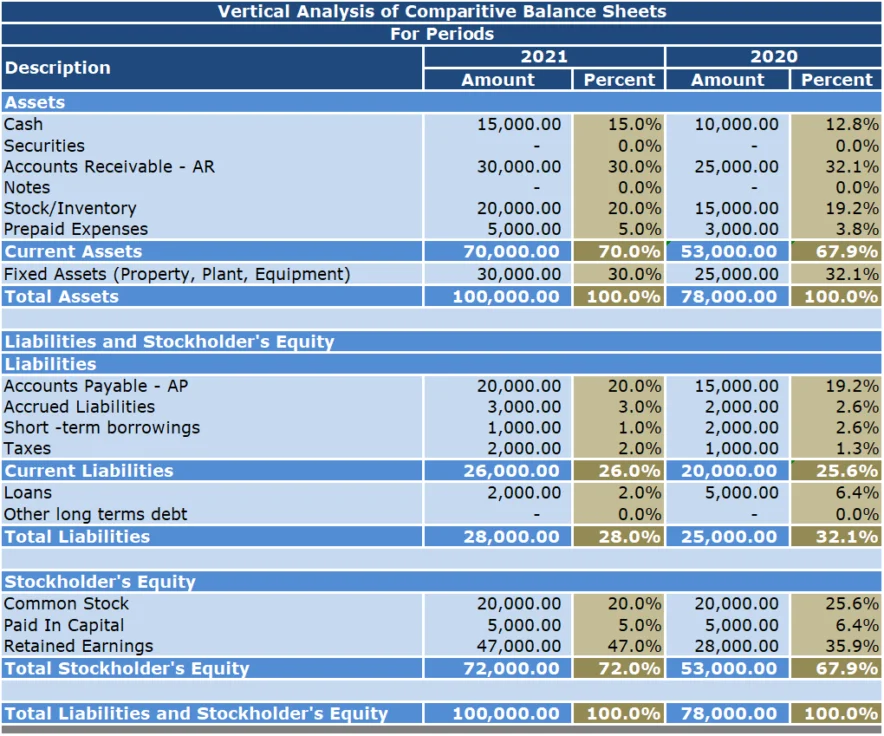
In a vertical analysis of a balance sheet the base is Total Assets and the formula is:
Percentage of base = (Amount of individual item/Amount of base item) × 100
We'll use Cash as our example.
Current Year
Percentage of base for Cash = (Amount of Cash/Total Assets) × 100
Percentage of base for Cash= (15,000 / 100,000) x 100
Percentage of base for Cash= 15%
Prior Year
Percentage of base for Cash = (Amount of Cash/Total Assets) × 100
Percentage of base for Cash= (10,000 / 78,000) x 100
Percentage of base for Cash= 12.8%
Sample Vertical Analysis Of an Income Statement
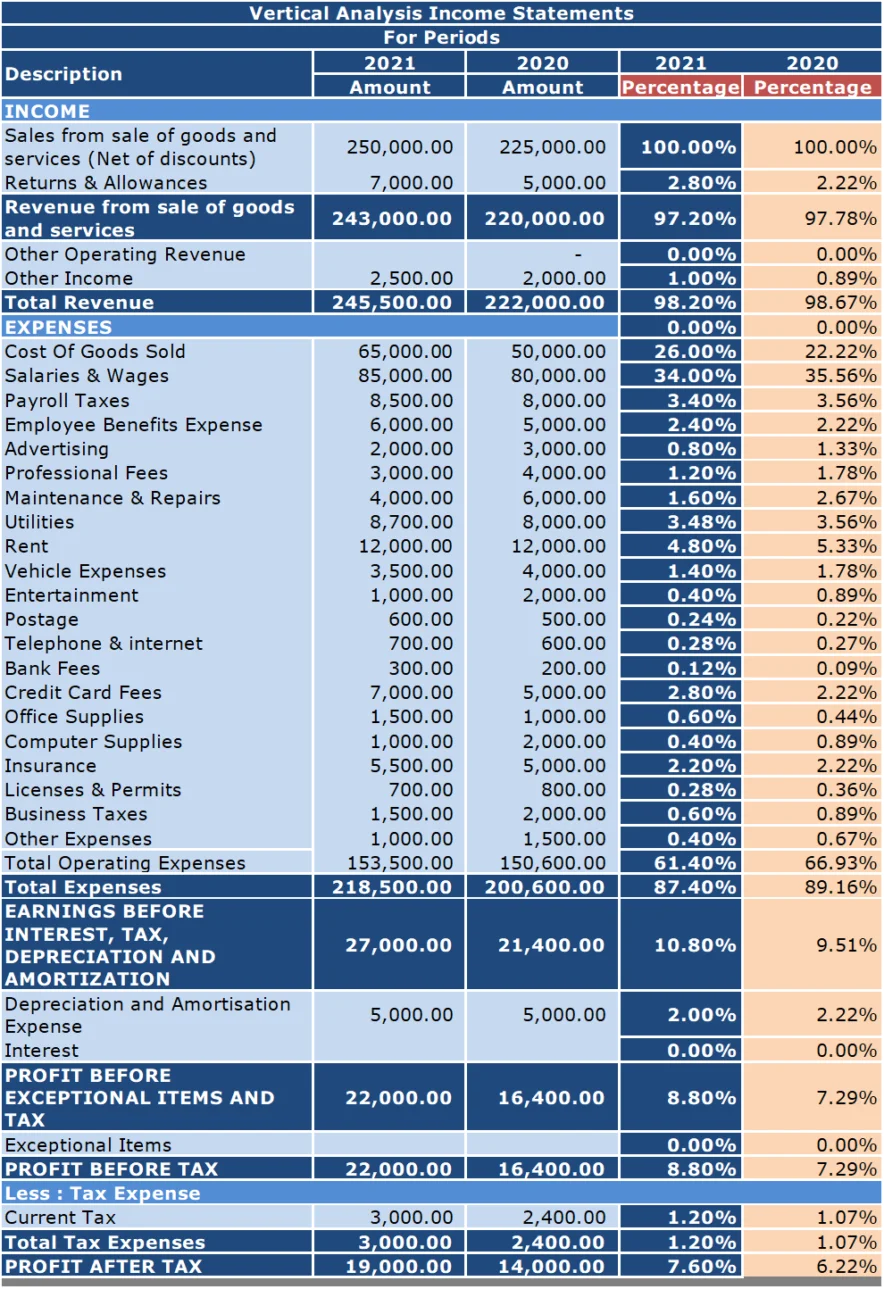
In a vertical analysis of an income statement the base is Sales (Revenue) and the formula is:
Percentage of base = (Amount of individual item/Amount of base item) × 100
We'll use Cost Of Goods Sold as our example.
Current Year
Percentage of base for Cost Of Goods Sold = (Amount of Cost Of Goods Sold /Sales) × 100
Percentage of base for Cost Of Goods Sold= (65,000 / 250,000) x 100
Percentage of base for Cost Of Goods Sold= 26%
Prior Year
Percentage of base for Cost Of Goods Sold = (Amount of Cost Of Goods Sold/Sales) × 100
Percentage of base for Cost Of Goods Sold= (50,000 / 225,000) x 100
Percentage of base for Cost Of Goods Sold= 22.22%
Both these statements present each item as a percentage based on Revenue being 100% for the Income Statements and Total Assets being 100% for the Balance Sheets.
Note: We could have even been a little fancier by grouping our expenses into categories such as Selling Expenses, and General & Administrative Expenses in our Income Statement. We could also expand the number of periods that we evaluated.

Now that we have the amounts what's next. That's half the battle, the other half is reviewing and discussing these statements with your bookkeeper or accountant if you have one. If not, you need to undertake this task yourself.
Some General Guidelines on How to Analyze the Amounts
From period to period, some items increase while others decrease so did we do well or not so well ? Many of the figures are related to our level of sales (sales volume). Some expenses remain the same (fixed expenses) while others increase or decrease (variable expenses) depending on the level of sales.
Variable costs fluctuate depending on how many products you produce or services you provide. When sales are high, variable costs increase. When sales are low, variable costs decrease. Some example of variable costs include commission on sales, credit card fees, direct labor, direct material, and production supplies.
Unlike variable costs, fixed costs are not affected by sales. No matter how many products you produce or services you provide, your fixed costs do not change. Fixed costs are unavoidable, basic operating expenses that your business pays. Since you pay the same amount from month to month, fixed costs are considered periodic expenses. Common examples of fixed costs include management salaries, rental and lease expenses, salaries, insurance expense, property taxes, interest expenses, depreciation, and some utilities and advertising expenses.
Key Figures:
Balance Sheet Items
Cash Position
Increase/Decrease Inventory
Increase/Decrease in Accounts Receivable
Increase/Decrease in Accounts Payable
Current Assets
Current Liabilities
Total Owner's Equity
Income Statement Items
Net Income/Profit
Increase/Decrease Sales
Increase/Decrease Costs & Expenses
Fixed Costs
Variable Costs
Next on our list Common Size Financial Statements